Traditional monitoring works on thresholds. CPU above 90% for five minutes? Alert. Disk usage over 85%? Alert. Response time above 500ms? Alert. This approach catches obvious problems, but it generates enormous volumes of noise — alerts that fire during known maintenance windows, transient spikes that resolve themselves, correlated alerts from a single root cause that flood every channel simultaneously. The result is alert fatigue, where operators start ignoring notifications because most of them are not actionable.
AI-powered monitoring adds an intelligence layer that traditional tools lack. A local LLM can analyze alert patterns and suppress duplicates, correlate related alerts to identify root causes, generate human-readable incident summaries, detect anomalies that static thresholds miss entirely, and predict capacity problems before they trigger alerts. All of this runs on your own infrastructure using open-source tools — Prometheus for metrics collection, Alertmanager for notification routing, Grafana for visualization, and Ollama for the AI processing layer.
This guide builds the complete stack from the ground up: configuring Prometheus with recording rules optimized for AI analysis, building an intelligent webhook processor that sits between Alertmanager and your notification channels, implementing anomaly detection using LLM-based pattern recognition, and creating auto-generated incident reports that save hours of manual analysis during outages. For the foundational setup, see our complete Ollama installation guide. For GPU driver setup, see our NVIDIA driver and CUDA installation guide.
Architecture Overview
The system adds an AI processing layer between your existing monitoring stack and notification channels. Prometheus collects metrics and evaluates alert rules as usual. Alertmanager handles grouping and routing. But instead of sending alerts directly to Slack or PagerDuty, Alertmanager sends them to a custom webhook service that uses a local LLM for intelligent processing before forwarding to the final destination.
# Architecture flow:
# Prometheus --> Alertmanager --> AI Webhook Processor --> Slack/PagerDuty/Email
#                                        |
#                                   Ollama (local LLM)
#                                        |
#                                   Decision Engine:
#                                   - Correlate alerts
#                                   - Suppress noise
#                                   - Generate summaries
#                                   - Detect anomalies
Prerequisites: The Monitoring Stack
If you already have Prometheus and Alertmanager running, skip to the AI integration section. Otherwise, here is a minimal setup.
Install Prometheus and Alertmanager
# Create system users
sudo useradd -r -s /usr/sbin/nologin prometheus
sudo useradd -r -s /usr/sbin/nologin alertmanager

# Download Prometheus
PROM_VERSION="2.51.0"
wget https://github.com/prometheus/prometheus/releases/download/v${PROM_VERSION}/prometheus-${PROM_VERSION}.linux-amd64.tar.gz
tar xzf prometheus-${PROM_VERSION}.linux-amd64.tar.gz
sudo mv prometheus-${PROM_VERSION}.linux-amd64/prometheus /usr/local/bin/
sudo mv prometheus-${PROM_VERSION}.linux-amd64/promtool /usr/local/bin/

# Download Alertmanager
AM_VERSION="0.27.0"
wget https://github.com/prometheus/alertmanager/releases/download/v${AM_VERSION}/alertmanager-${AM_VERSION}.linux-amd64.tar.gz
tar xzf alertmanager-${AM_VERSION}.linux-amd64.tar.gz
sudo mv alertmanager-${AM_VERSION}.linux-amd64/alertmanager /usr/local/bin/
sudo mv alertmanager-${AM_VERSION}.linux-amd64/amtool /usr/local/bin/

# Create directories
sudo mkdir -p /etc/prometheus /var/lib/prometheus
sudo mkdir -p /etc/alertmanager /var/lib/alertmanager
sudo chown prometheus:prometheus /etc/prometheus /var/lib/prometheus
sudo chown alertmanager:alertmanager /etc/alertmanager /var/lib/alertmanager
Configure Prometheus with Alert Rules
# /etc/prometheus/prometheus.yml
global:
  scrape_interval: 15s
  evaluation_interval: 15s

alerting:
  alertmanagers:
    - static_configs:
        - targets: ['localhost:9093']

rule_files:
  - /etc/prometheus/rules/*.yml

scrape_configs:
  - job_name: 'node'
    static_configs:
      - targets: ['localhost:9100', '10.0.1.10:9100', '10.0.1.11:9100']

  - job_name: 'prometheus'
    static_configs:
      - targets: ['localhost:9090']
# /etc/prometheus/rules/basic_alerts.yml
groups:
- name: host_alerts
rules:
- alert: HighCPUUsage
expr: 100 - (avg by(instance) (rate(node_cpu_seconds_total{mode="idle"}[5m])) * 100) > 85
for: 10m
labels:
severity: warning
annotations:
summary: "High CPU usage on {{ $labels.instance }}"
description: "CPU usage is {{ $value | printf \"%.1f\" }}% on {{ $labels.instance }}"
- alert: HighMemoryUsage
expr: (1 - node_memory_MemAvailable_bytes / node_memory_MemTotal_bytes) * 100 > 90
for: 5m
labels:
severity: warning
annotations:
summary: "High memory usage on {{ $labels.instance }}"
description: "Memory usage is {{ $value | printf \"%.1f\" }}% on {{ $labels.instance }}"
- alert: DiskSpaceLow
expr: (1 - node_filesystem_avail_bytes{mountpoint="/"} / node_filesystem_size_bytes{mountpoint="/"}) * 100 > 85
for: 5m
labels:
severity: critical
annotations:
summary: "Disk space low on {{ $labels.instance }}"
description: "Root filesystem is {{ $value | printf \"%.1f\" }}% full on {{ $labels.instance }}"
- alert: InstanceDown
expr: up == 0
for: 2m
labels:
severity: critical
annotations:
summary: "Instance {{ $labels.instance }} is down"
description: "{{ $labels.instance }} has been unreachable for more than 2 minutes"Configure Alertmanager to Send to AI Webhook
# /etc/alertmanager/alertmanager.yml
global:
  resolve_timeout: 5m

route:
  receiver: 'ai-processor'
  group_by: ['alertname', 'instance']
  group_wait: 30s
  group_interval: 5m
  repeat_interval: 4h

receivers:
  - name: 'ai-processor'
    webhook_configs:
      - url: 'http://localhost:5090/webhook/alertmanager'
        send_resolved: true
        max_alerts: 50
Building the AI Alert Processor
The core of this system is a webhook service that receives alerts from Alertmanager, processes them through a local LLM, and forwards intelligent summaries to your notification channels.
Install Ollama and a Suitable Model
# Install Ollama
curl -fsSL https://ollama.com/install.sh | sh
sudo systemctl enable --now ollama

# Pull a model suited for alert analysis
# Llama 3.1 8B is fast enough for real-time alert processing
ollama pull llama3.1:8b

# For higher quality analysis (if you have the VRAM)
ollama pull qwen2.5:14b-instruct-q4_K_M
The AI Alert Processor Service
#!/usr/bin/env python3
"""ai-alert-processor: Intelligent alert processing with local LLMs."""

import json
import time
import hashlib
from datetime import datetime, timedelta
from collections import defaultdict
from flask import Flask, request
import requests

app = Flask(__name__)

OLLAMA_API = "http://localhost:11434/api/generate"
MODEL = "llama3.1:8b"
SLACK_WEBHOOK = "https://hooks.slack.com/services/YOUR/WEBHOOK/URL"

# Alert history for correlation (in-memory, use Redis for production)
alert_history = defaultdict(list)
suppressed_alerts = {}

def query_llm(prompt, temperature=0.1):
    """Query the local LLM."""
    resp = requests.post(OLLAMA_API, json={
        "model": MODEL,
        "prompt": prompt,
        "stream": False,
        "options": {"temperature": temperature, "num_predict": 1024}
    }, timeout=60)
    if resp.status_code == 200:
        return resp.json().get("response", "")
    return ""

def correlate_alerts(alerts):
    """Use the LLM to find correlations between active alerts."""
    if len(alerts) < 2:
        return None

    alert_descriptions = []
    for a in alerts:
        labels = a.get("labels", {})
        annotations = a.get("annotations", {})
        alert_descriptions.append(
            f"- {labels.get('alertname', 'unknown')}: "
            f"{annotations.get('summary', 'no summary')} "
            f"(instance: {labels.get('instance', 'unknown')}, "
            f"severity: {labels.get('severity', 'unknown')})"
        )

    prompt = (
        "These alerts fired at approximately the same time. "
        "Determine if they share a common root cause.\n\n"
        "Active alerts:\n" + "\n".join(alert_descriptions) + "\n\n"
        "If correlated, identify the likely root cause in one sentence. "
        "If independent, say 'Independent alerts.' Only output the analysis."
    )

    return query_llm(prompt)

def generate_incident_summary(alerts, correlation):
    """Generate a human-readable incident summary."""
    alert_details = json.dumps([{
        "alertname": a.get("labels", {}).get("alertname"),
        "instance": a.get("labels", {}).get("instance"),
        "severity": a.get("labels", {}).get("severity"),
        "summary": a.get("annotations", {}).get("summary"),
        "description": a.get("annotations", {}).get("description"),
        "status": a.get("status"),
    } for a in alerts], indent=2)

    prompt = (
        "Generate a concise incident summary for an operations team.\n"
        "Include: what happened, which systems are affected, severity, "
        "and suggested first response actions.\n\n"
        f"Alerts:\n{alert_details}\n\n"
    )
    if correlation:
        prompt += f"Root cause analysis: {correlation}\n\n"
    prompt += "Format as a brief incident report (5-8 lines maximum)."

    return query_llm(prompt)

def should_suppress(alert):
    """Determine if an alert should be suppressed based on recent history."""
    alert_key = hashlib.sha256(json.dumps(
        alert.get("labels", {}), sort_keys=True
    ).encode()).hexdigest()[:12]

    now = time.time()

    # Check if this exact alert was suppressed recently
    if alert_key in suppressed_alerts:
        if now - suppressed_alerts[alert_key] < 3600:  # 1 hour
            return True

    # Check alert frequency — if the same alert has fired >5 times
    # in the last hour, suppress further notifications
    history = alert_history[alert_key]
    recent = [t for t in history if now - t < 3600]
    alert_history[alert_key] = recent

    if len(recent) > 5:
        suppressed_alerts[alert_key] = now
        return True

    alert_history[alert_key].append(now)
    return False

def send_to_slack(message):
    """Send a formatted message to Slack."""
    requests.post(SLACK_WEBHOOK, json={"text": message}, timeout=10)

@app.route("/webhook/alertmanager", methods=["POST"])
def handle_alertmanager():
    data = request.get_json()
    alerts = data.get("alerts", [])
    firing = [a for a in alerts if a["status"] == "firing"]
    resolved = [a for a in alerts if a["status"] == "resolved"]

    # Process resolved alerts
    for alert in resolved:
        name = alert.get("labels", {}).get("alertname", "Unknown")
        instance = alert.get("labels", {}).get("instance", "unknown")
        send_to_slack(f"Resolved: {name} on {instance}")

    if not firing:
        return "OK", 200

    # Filter out alerts that should be suppressed
    actionable = [a for a in firing if not should_suppress(a)]

    if not actionable:
        return "OK (suppressed)", 200

    # Correlate alerts if multiple are firing
    correlation = correlate_alerts(actionable)

    # Generate incident summary
    summary = generate_incident_summary(actionable, correlation)

    # Send enriched alert to Slack
    message_parts = ["*Incident Report*\n"]
    if correlation and "Independent" not in correlation:
        message_parts.append(f"*Root Cause Analysis:* {correlation}\n")
    message_parts.append(f"\n{summary}")
    message_parts.append(f"\n_Alerts in group: {len(actionable)}_")

    send_to_slack("\n".join(message_parts))
    return "OK", 200

if __name__ == "__main__":
    app.run(host="0.0.0.0", port=5090)
Anomaly Detection with LLM Pattern Analysis
Static thresholds miss slow-burn issues like gradual memory leaks, slowly filling disks, and performance degradation trends. An LLM can analyze metric patterns and detect anomalies that simple threshold rules cannot catch.
Metric Trend Analyzer
#!/usr/bin/env python3
"""anomaly_detector.py — LLM-based anomaly detection for Prometheus metrics."""

import json
import requests
from datetime import datetime, timedelta

PROMETHEUS_URL = "http://localhost:9090"
OLLAMA_API = "http://localhost:11434/api/generate"
MODEL = "llama3.1:8b"

def query_prometheus(query, hours=24):
    """Fetch metric data from Prometheus for the specified time range."""
    end = datetime.now()
    start = end - timedelta(hours=hours)
    resp = requests.get(f"{PROMETHEUS_URL}/api/v1/query_range", params={
        "query": query,
        "start": start.isoformat() + "Z",
        "end": end.isoformat() + "Z",
        "step": "5m",
    })
    return resp.json().get("data", {}).get("result", [])

def analyze_trend(metric_name, query, hours=24):
    """Analyze a metric trend using the LLM."""
    data = query_prometheus(query, hours)

    if not data:
        return None

    # Extract values and format for LLM analysis
    for series in data:
        instance = series["metric"].get("instance", "unknown")
        values = series["values"]

        # Sample every 12th point to keep the prompt manageable
        sampled = values[::12]
        points = [
            f"{datetime.fromtimestamp(float(v[0])).strftime('%H:%M')}: {float(v[1]):.2f}"
            for v in sampled
        ]

        prompt = (
            f"Analyze this {metric_name} time series for {instance} "
            f"over the last {hours} hours.\n\n"
            "Data points (time: value):\n" +
            "\n".join(points) + "\n\n"
            "Identify any anomalies: sudden spikes, gradual trends toward "
            "danger, unusual patterns, or cyclical behavior that deviates "
            "from normal. If everything looks normal, say 'No anomalies detected.'\n"
            "Be specific about what you observe and when it occurred."
        )

        resp = requests.post(OLLAMA_API, json={
            "model": MODEL, "prompt": prompt,
            "stream": False,
            "options": {"temperature": 0.1}
        }, timeout=60)

        analysis = resp.json().get("response", "")
        if "no anomal" not in analysis.lower():
            print(f"[ANOMALY] {metric_name} on {instance}:")
            print(analysis)
            print("---")

# Run analysis on key metrics
metrics = {
    "CPU Usage": '100 - (avg by(instance) (rate(node_cpu_seconds_total{mode="idle"}[5m])) * 100)',
    "Memory Usage": '(1 - node_memory_MemAvailable_bytes / node_memory_MemTotal_bytes) * 100',
    "Disk Usage": '(1 - node_filesystem_avail_bytes{mountpoint="/"} / node_filesystem_size_bytes{mountpoint="/"}) * 100',
    "Network Errors": 'rate(node_network_receive_errs_total[5m])',
    "Load Average": 'node_load15',
}

for name, query in metrics.items():
    print(f"\nAnalyzing: {name}")
    analyze_trend(name, query, hours=24)
Schedule Anomaly Detection with a Systemd Timer
# /etc/systemd/system/anomaly-check.service
[Unit]
Description=AI Anomaly Detection Check
After=ollama.service prometheus.service

[Service]
Type=oneshot
User=prometheus
ExecStart=/opt/ai-monitoring/venv/bin/python3 /opt/ai-monitoring/anomaly_detector.py
Environment=PYTHONUNBUFFERED=1

# /etc/systemd/system/anomaly-check.timer
[Unit]
Description=Run anomaly detection every hour

[Timer]
OnCalendar=hourly
Persistent=true
RandomizedDelaySec=300

[Install]
WantedBy=timers.target
# Enable the timer
sudo systemctl daemon-reload
sudo systemctl enable --now anomaly-check.timer
# Check the timer status
systemctl list-timers anomaly-check.timerAuto-Generated Incident Reports
During an outage, engineers spend significant time writing incident reports and status updates. The AI processor can generate these automatically by combining alert data with recent metric trends.
def generate_full_incident_report(alerts, start_time):
    """Generate a detailed incident report with timeline and metrics."""

    # Gather metric context from Prometheus
    instances = set()
    for a in alerts:
        inst = a.get("labels", {}).get("instance")
        if inst:
            instances.add(inst)

    metric_context = ""
    for instance in instances:
        # Get CPU, memory, disk for affected instances
        for metric, query in [
            ("CPU", f'100 - (avg(rate(node_cpu_seconds_total{{mode="idle",instance="{instance}"}}[5m])) * 100)'),
            ("Memory", f'(1 - node_memory_MemAvailable_bytes{{instance="{instance}"}} / node_memory_MemTotal_bytes{{instance="{instance}"}}) * 100'),
        ]:
            data = query_prometheus(query, hours=2)
            if data and data[0]["values"]:
                current = float(data[0]["values"][-1][1])
                metric_context += f"{instance} {metric}: {current:.1f}%\n"

    alert_timeline = "\n".join([
        f"  {a.get('startsAt', 'unknown')}: "
        f"{a.get('labels', {}).get('alertname')} - "
        f"{a.get('annotations', {}).get('summary')}"
        for a in sorted(alerts, key=lambda x: x.get("startsAt", ""))
    ])

    prompt = (
        "Write a professional incident report based on this data.\n\n"
        f"Incident start: {start_time}\n"
        f"Alert timeline:\n{alert_timeline}\n\n"
        f"Current metrics:\n{metric_context}\n"
        "Include: Executive summary, Impact, Timeline, "
        "Current status, and Next steps. Keep it under 200 words."
    )

    return query_llm(prompt)
Reducing Alert Fatigue with Intelligent Grouping
Alertmanager already groups alerts by label, but that grouping is static and rule-based. The AI layer adds semantic grouping — understanding that a "disk full" alert and a "log rotation failed" alert on the same server are probably related, even though they have different alert names and labels.
def semantic_group(alerts):
    """Group alerts by likely root cause using LLM analysis."""
    if len(alerts) <= 1:
        return [alerts]

    alert_summaries = []
    for i, a in enumerate(alerts):
        labels = a.get("labels", {})
        annotations = a.get("annotations", {})
        alert_summaries.append(
            f"{i}: [{labels.get('severity', '?')}] "
            f"{labels.get('alertname', '?')} on "
            f"{labels.get('instance', '?')} - "
            f"{annotations.get('summary', 'no summary')}"
        )

    prompt = (
        "Group these alerts by likely root cause. "
        "Output ONLY a JSON array of arrays, where each inner array "
        "contains the alert indices that belong together.\n\n"
        "Alerts:\n" + "\n".join(alert_summaries) + "\n\n"
        "Example output: [[0,2,4],[1,3],[5]]"
    )

    response = query_llm(prompt)

    try:
        groups = json.loads(response.strip())
        return [[alerts[i] for i in group] for group in groups]
    except (json.JSONDecodeError, IndexError):
        return [alerts]  # Fall back to single group
Systemd Service for the AI Processor
# /etc/systemd/system/ai-alert-processor.service
[Unit]
Description=AI Alert Processor for Monitoring
After=network.target ollama.service
Requires=ollama.service

[Service]
Type=simple
User=alertmanager
Group=alertmanager
WorkingDirectory=/opt/ai-monitoring

ExecStart=/opt/ai-monitoring/venv/bin/python3 ai_alert_processor.py
Restart=on-failure
RestartSec=5

Environment=OLLAMA_API=http://localhost:11434/api/generate
Environment=MODEL=llama3.1:8b

NoNewPrivileges=true
ProtectSystem=strict
ProtectHome=true
PrivateTmp=true

[Install]
WantedBy=multi-user.target
# Deploy the service
sudo systemctl daemon-reload
sudo systemctl enable --now ai-alert-processor.service
# Verify it is running
sudo systemctl status ai-alert-processor.service
curl -s http://localhost:5090/healthGrafana Dashboard Integration
Grafana can display AI-generated insights alongside traditional metric panels. Use the Grafana text panel with a data source that queries your AI processor's API for summaries.
# Add a health summary endpoint to the AI processor
@app.route("/api/health-summary", methods=["GET"])
def health_summary():
    """Generate an AI summary of current system health."""
    # Query Prometheus for key metrics
    metrics = {}
    for name, query in [
        ("cpu", 'avg(100 - (rate(node_cpu_seconds_total{mode="idle"}[5m]) * 100))'),
        ("memory", 'avg((1 - node_memory_MemAvailable_bytes / node_memory_MemTotal_bytes) * 100)'),
        ("active_alerts", 'count(ALERTS{alertstate="firing"})'),
    ]:
        resp = requests.get(f"{PROMETHEUS_URL}/api/v1/query", params={"query": query})
        result = resp.json().get("data", {}).get("result", [])
        if result:
            metrics[name] = float(result[0]["value"][1])

    prompt = (
        "Write a 2-3 sentence system health summary.\n"
        f"Average CPU: {metrics.get('cpu', 0):.1f}%\n"
        f"Average Memory: {metrics.get('memory', 0):.1f}%\n"
        f"Active alerts: {int(metrics.get('active_alerts', 0))}\n"
        "Be direct. No filler words."
    )

    summary = query_llm(prompt)
    return {"summary": summary, "metrics": metrics}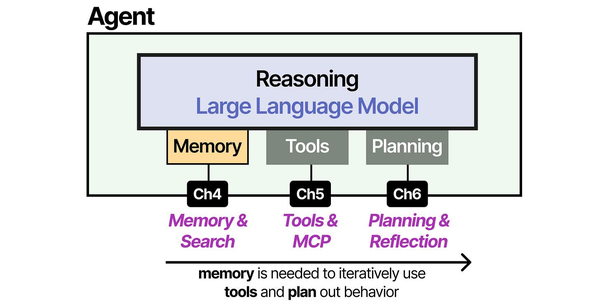
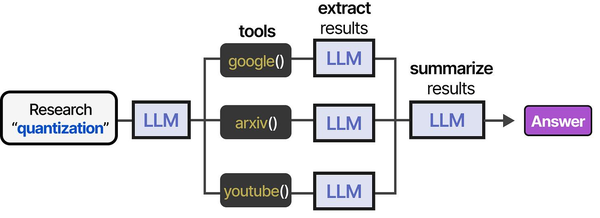
Monitoring AI systems on Linux requires a fundamentally different approach than traditional infrastructure observability. As Grootendorst and Alammar explain in An Illustrated Guide to AI Agents, agent architectures introduce multiple new failure modes — from model drift and hallucination spikes to memory overflow and tool invocation failures — that conventional metrics like CPU and memory utilization cannot capture. Ranjan, Chembachere, and Lobo in Agentic AI in Enterprise advocate for layered monitoring strategies that combine system-level metrics (GPU utilization, VRAM allocation, inference latency) with application-level signals (token throughput, response quality scores, tool call success rates) to provide comprehensive observability for self-hosted AI stacks.
Related Articles
- AI-Powered Log Analysis on Linux: Use Ollama to Parse Syslog, Journald, and Application Logs
- GPU Monitoring for AI Workloads on Linux: Tools, Dashboards, and Alerts
- AI-Assisted Ansible Troubleshooting with Local LLMs on Linux
- Self-Hosted AI Email Assistant on Linux with n8n and Ollama
Further Reading
- An Illustrated Guide to AI Agents by Maarten Grootendorst and Jay Alammar — Visual guide to agent memory, tools, and reasoning.
- LLMs in Production by Christopher Brousseau and Matthew Sharp — Practical deployment of language models from training to production.
- Agentic AI in Enterprise by Sumit Ranjan, Divya Chembachere, and Lanwin Lobo — Enterprise architecture patterns for agentic AI systems.
Frequently Asked Questions
How much latency does LLM processing add to alert delivery?
With Llama 3.1 8B on a GPU-equipped server, the LLM processing adds 2-5 seconds per alert group. Alertmanager's group_wait (30 seconds by default) already introduces more delay than the AI processing. For critical alerts where seconds matter, configure Alertmanager to send critical-severity alerts directly to PagerDuty in addition to the AI processor, so the page goes out immediately while the enriched summary follows.
Does this replace human on-call engineers?
No. The AI layer reduces noise and provides context — it does not make operational decisions or remediate issues. Think of it as an intelligent filter and summarizer. On-call engineers still receive alerts for genuine incidents, but they get fewer false positives and better context for the alerts they do receive. In testing, teams report 40-60% reduction in non-actionable alerts after deploying AI processing.
What happens if Ollama goes down during an alert storm?
The AI processor should always have a fallback path. If the LLM call fails (timeout, connection refused), the processor forwards the raw alert to the notification channel without AI enrichment. Never let AI processing become a single point of failure for your alerting pipeline. The sample code includes timeout handling and fallback behavior.
Can this work with monitoring tools other than Prometheus?
Yes. The AI processor is a generic webhook receiver. Any monitoring tool that can send webhooks (Zabbix, Datadog, Nagios with plugins, Icinga) can send alerts to it. You will need to adjust the alert parsing code to match the webhook format of your monitoring tool, but the LLM processing logic remains the same.
How do I tune the suppression thresholds?
Start conservative — the sample code suppresses after 5 identical alerts within an hour. Monitor the suppression logs for the first week and adjust based on your environment. Some alerts (like disk space warnings) should be suppressed aggressively after the first notification. Others (like instance down alerts) should never be suppressed. Add per-alert-name suppression rules in your configuration to fine-tune the behavior.