Every Linux server generates an enormous volume of logs, and the traditional approach to analyzing them — grep, awk, regular expressions, and pattern matching — works well for known problems. You write a regex for the error you expect, and you find it. But what about errors you do not expect? What about correlating events across multiple log sources? What about that situation where a developer says "something is wrong" but the logs contain no obvious errors, just subtle patterns that a human reading thousands of lines would eventually notice? This is where local LLMs become genuinely useful as a sysadmin tool.
Running Ollama on your server gives you a local inference engine that can process log data without sending anything to a cloud API. This matters for logs because they contain hostnames, IP addresses, usernames, application internals, and sometimes credentials that should never leave your network. The approach is practical, not theoretical — I have been using the tools in this guide on production servers for months, and they have caught issues that grep-based monitoring missed entirely. That said, LLMs are not a replacement for structured log analysis. They are a complement, and knowing when to use them versus when to use traditional tools is just as important as knowing how.
Why LLMs Are Useful for Log Analysis
Traditional log analysis tools are excellent at exact matching. If you know the error string, grep finds it instantly. But LLMs bring three capabilities that grep fundamentally cannot provide: For GPU driver setup, see our NVIDIA driver and CUDA installation guide.
- Pattern recognition across unstructured text — An LLM can identify that five different log lines are all describing variations of the same underlying problem, even when they use different wording, come from different services, or appear in different formats.
- Natural language queries — Instead of constructing a regex to find "authentication failures from unusual locations," you can literally ask "show me any suspicious login activity in these logs" and get a meaningful response.
- Anomaly narrative — An LLM can summarize what happened in a sequence of log events as a coherent story: "At 14:32, the database connection pool was exhausted. This caused the API server to return 503 errors. Three minutes later, the load balancer marked the backend as unhealthy and stopped routing traffic."
These capabilities are most valuable during incident investigation, when you are looking at logs from a timeframe and trying to understand what happened rather than searching for a specific known error.
Setting Up the Pipeline
The basic approach is simple: extract logs, pipe them to Ollama, read the analysis. Make sure Ollama is installed and you have a suitable model pulled:
# Install Ollama if not already present
curl -fsSL https://ollama.com/install.sh | sh

# Pull a model good at analysis tasks
ollama pull llama3.1:8b

# For more complex analysis, a larger model helps
ollama pull llama3.1:70b  # If you have the VRAM
For log analysis, the 8B model handles most tasks well. The 70B model provides noticeably better analysis for complex, multi-service incidents but requires 40+ GB of VRAM. In practice, start with 8B and escalate to 70B only when the smaller model misses things.
Piping journalctl Output to Ollama
The most direct approach — pipe journal entries to Ollama and ask questions:
# Analyze the last hour of system logs
journalctl --since "1 hour ago" --no-pager | \
head -200 | \
ollama run llama3.1:8b "Analyze these Linux system logs. Identify any errors, warnings, or unusual patterns. Summarize what happened:
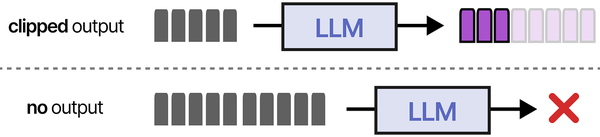
$(cat)"The head -200 is important. LLMs have context windows, and sending 50,000 log lines will either exceed the context or produce garbage output because the model cannot attend to that much text effectively. Keep input under 200-300 lines for the 8B model (8K context) and under 1000 lines for models with larger context windows.
A more targeted approach — filter before sending:
# Only errors and warnings from the last 24 hours
journalctl --since "24 hours ago" --priority=0..4 --no-pager | \
    ollama run llama3.1:8b "These are error and warning logs from a Linux server in the last 24 hours. Identify the most critical issues, group related errors together, and suggest what to investigate first:

$(cat)"
# Specific service analysis
journalctl -u nginx --since "6 hours ago" --no-pager | tail -300 | \
ollama run llama3.1:8b "Analyze these nginx logs. Look for configuration errors, upstream failures, or unusual traffic patterns:
$(cat)"Building a Python Log Analyzer
For repeated use, a proper script is better than one-liners. Here is a Python tool that reads logs, chunks them appropriately, and sends them to Ollama with structured prompts:
#!/usr/bin/env python3
"""log-analyzer.py — Analyze Linux logs with Ollama."""

import subprocess
import json
import sys
import argparse
from datetime import datetime

OLLAMA_URL = "http://localhost:11434/api/generate"
MODEL = "llama3.1:8b"
MAX_LINES = 250

def query_ollama(prompt, model=MODEL):
    """Send a prompt to Ollama and return the response."""
    payload = {
        "model": model,
        "prompt": prompt,
        "stream": False,
        "options": {
            "temperature": 0.3,  # Low temperature for factual analysis
            "num_predict": 2048
        }
    }

    result = subprocess.run(
        ["curl", "-s", "-X", "POST", OLLAMA_URL,
         "-H", "Content-Type: application/json",
         "-d", json.dumps(payload)],
        capture_output=True, text=True, timeout=300
    )

    if result.returncode != 0:
        print(f"Error calling Ollama: {result.stderr}", file=sys.stderr)
        sys.exit(1)

    response = json.loads(result.stdout)
    return response.get("response", "No response")


def get_journal_logs(unit=None, since=None, priority=None, lines=MAX_LINES):
    """Fetch logs from journalctl."""
    cmd = ["journalctl", "--no-pager", "-o", "short-iso"]

    if unit:
        cmd.extend(["-u", unit])
    if since:
        cmd.extend(["--since", since])
    if priority:
        cmd.extend([f"--priority={priority}"])

    result = subprocess.run(cmd, capture_output=True, text=True)
    log_lines = result.stdout.strip().split("\n")

    # Take the last N lines (most recent)
    if len(log_lines) > lines:
        log_lines = log_lines[-lines:]
        truncated = True
    else:
        truncated = False

    return "\n".join(log_lines), len(log_lines), truncated


def read_log_file(filepath, lines=MAX_LINES):
    """Read a log file, returning the last N lines."""
    with open(filepath, 'r') as f:
        all_lines = f.readlines()

    if len(all_lines) > lines:
        return "".join(all_lines[-lines:]), lines, True
    return "".join(all_lines), len(all_lines), False


def analyze_logs(logs, analysis_type="general"):
    """Send logs to Ollama for analysis."""
    prompts = {
        "general": (
            "You are analyzing Linux server logs. Examine the following log entries "
            "and provide:\n"
            "1. A summary of the overall system state\n"
            "2. Any errors or warnings that need attention\n"
            "3. Patterns that suggest developing problems\n"
            "4. Recommended actions, prioritized by severity\n\n"
            "Be specific — reference exact timestamps and services.\n\n"
            f"LOGS:\n{logs}"
        ),
        "security": (
            "You are a security analyst examining Linux server logs. Focus on:\n"
            "1. Failed authentication attempts and their source IPs\n"
            "2. Privilege escalation or sudo usage patterns\n"
            "3. Unusual service starts/stops\n"
            "4. Any indicators of compromise\n"
            "5. Brute force patterns (repeated failures from same source)\n\n"
            "Rate the overall security risk level: LOW, MEDIUM, HIGH, or CRITICAL.\n\n"
            f"LOGS:\n{logs}"
        ),
        "performance": (
            "You are analyzing Linux server logs for performance issues. Look for:\n"
            "1. OOM killer events\n"
            "2. Disk I/O errors or slow operations\n"
            "3. Service restart patterns (crashing services)\n"
            "4. Resource exhaustion indicators\n"
            "5. Network timeout patterns\n\n"
            "Estimate the severity of each issue found.\n\n"
            f"LOGS:\n{logs}"
        ),
        "nginx": (
            "You are analyzing nginx web server logs. Identify:\n"
            "1. Error rate and common error codes (4xx, 5xx)\n"
            "2. Upstream connection failures\n"
            "3. Unusual request patterns (potential attacks)\n"
            "4. Slow response times\n"
            "5. Configuration issues visible in error logs\n\n"
            f"LOGS:\n{logs}"
        )
    }

    prompt = prompts.get(analysis_type, prompts["general"])
    return query_ollama(prompt)


def main():
    parser = argparse.ArgumentParser(description="Analyze logs with Ollama")
    parser.add_argument("--source", choices=["journal", "file"],
                       default="journal", help="Log source")
    parser.add_argument("--unit", "-u", help="Systemd unit for journal")
    parser.add_argument("--since", "-s", default="1 hour ago",
                       help="Time range (journal)")
    parser.add_argument("--priority", "-p",
                       help="Priority filter (0-7 or range like 0..4)")
    parser.add_argument("--file", "-f", help="Log file path")
    parser.add_argument("--type", "-t",
                       choices=["general", "security", "performance", "nginx"],
                       default="general", help="Analysis type")
    parser.add_argument("--lines", "-n", type=int, default=MAX_LINES,
                       help=f"Max lines to analyze (default {MAX_LINES})")
    parser.add_argument("--model", "-m", default=MODEL,
                       help=f"Ollama model (default {MODEL})")

    args = parser.parse_args()
    global MODEL
    MODEL = args.model

    print(f"[*] Log analysis — {args.type} mode")
    print(f"[*] Model: {MODEL}")
    print(f"[*] Fetching logs...")

    if args.source == "file" and args.file:
        logs, count, truncated = read_log_file(args.file, args.lines)
    else:
        logs, count, truncated = get_journal_logs(
            unit=args.unit, since=args.since,
            priority=args.priority, lines=args.lines
        )

    if truncated:
        print(f"[*] Truncated to last {count} lines")
    else:
        print(f"[*] Loaded {count} lines")

    if count == 0:
        print("[!] No log entries found")
        sys.exit(0)

    print(f"[*] Analyzing with {MODEL}...")
    print("=" * 60)

    analysis = analyze_logs(logs, args.type)
    print(analysis)
    print("=" * 60)
    print(f"[*] Analysis complete — {datetime.now().isoformat()}")


if __name__ == "__main__":
    main()
Usage examples:
# General system analysis, last hour
python3 log-analyzer.py --type general --since "1 hour ago"

# Security analysis of SSH/auth logs
python3 log-analyzer.py --type security --unit sshd --since "24 hours ago"

# Nginx log analysis from file
python3 log-analyzer.py --source file --file /var/log/nginx/error.log --type nginx

# Performance analysis with a larger model
python3 log-analyzer.py --type performance --since "6 hours ago" --model llama3.1:70b
Analyzing auth.log for Security Incidents
Security log analysis is where LLMs shine compared to traditional tools. A regex can count failed login attempts; an LLM can explain the attack pattern.
# Extract recent auth events
journalctl -u sshd --since "24 hours ago" --no-pager | tail -200 | \
    ollama run llama3.1:8b "Analyze these SSH authentication logs from a Linux server. For each source IP with failed attempts:
1. Count the failures
2. Identify what usernames were tried
3. Classify the attack type (brute force, credential stuffing, targeted)
4. Recommend firewall rules

$(cat)"
Here is what a real analysis looks like. Given these auth.log entries:
Mar 15 03:22:41 server sshd[45821]: Failed password for invalid user admin from 203.0.113.45 port 52341
Mar 15 03:22:43 server sshd[45823]: Failed password for invalid user root from 203.0.113.45 port 52355
Mar 15 03:22:44 server sshd[45825]: Failed password for invalid user test from 203.0.113.45 port 52370
Mar 15 03:22:46 server sshd[45827]: Failed password for invalid user ubuntu from 203.0.113.45 port 52389
Mar 15 03:22:48 server sshd[45829]: Failed password for invalid user pi from 203.0.113.45 port 52401
Mar 15 04:15:22 server sshd[46102]: Failed password for deploy from 198.51.100.12 port 44122
Mar 15 04:15:25 server sshd[46104]: Failed password for deploy from 198.51.100.12 port 44138
Mar 15 04:15:28 server sshd[46106]: Failed password for deploy from 198.51.100.12 port 44155
Mar 15 08:30:01 server sshd[47533]: Accepted publickey for admin from 192.168.1.50 port 62221
The LLM will typically produce analysis like: "Two distinct attack patterns detected. IP 203.0.113.45 is performing a dictionary attack, rapidly trying common default usernames (admin, root, test, ubuntu, pi) at 2-second intervals. This is automated scanning. IP 198.51.100.12 is specifically targeting the 'deploy' user with repeated attempts, suggesting either credential stuffing or a targeted attack where the attacker knows this username exists. The successful login from 192.168.1.50 using a public key is legitimate internal access. Recommendation: block 203.0.113.45 and 198.51.100.12 with firewall-cmd --add-rich-rule or add to fail2ban."
A grep-based approach would find the failures, but it would not classify the attack patterns or distinguish between automated scanning and targeted attempts without significantly more complex scripting.
Parsing Nginx Access Logs for Anomalies
# Analyze recent nginx access patterns
tail -300 /var/log/nginx/access.log | \
    ollama run llama3.1:8b "These are nginx access logs. Identify:
1. Any unusually high request rates from single IPs
2. Suspicious URL patterns (path traversal, SQL injection attempts, scanner fingerprints)
3. Unusual user agents (bots, scanners, missing user agents)
4. Abnormal response code distributions
5. Any signs of automated attacks

$(cat)"
For error log analysis:
tail -100 /var/log/nginx/error.log | \
    ollama run llama3.1:8b "Analyze these nginx error logs. Group related errors, identify root causes, and suggest fixes for each issue:

$(cat)"
Shell Function for Quick Log Queries
Add this to your ~/.bashrc for instant access to AI-powered log analysis from any terminal:
# AI log analysis function
logai() {
    local mode="${1:-general}"
    local timeframe="${2:-1 hour ago}"
    local unit="${3:-}"
    local lines=200

    echo "[*] Mode: $mode | Timeframe: since $timeframe | Unit: ${unit:-all}"

    local cmd="journalctl --since '$timeframe' --no-pager"
    [ -n "$unit" ] && cmd="$cmd -u $unit"

    local logs
    logs=$(eval "$cmd" | tail -$lines)
    local count=$(echo "$logs" | wc -l)
    echo "[*] Analyzing $count log lines..."

    local prompt
    case "$mode" in
        security)
            prompt="Analyze these logs for security issues. Check for failed logins, privilege escalation, suspicious processes, and unauthorized access attempts. Rate the risk level."
            ;;
        errors)
            prompt="List all errors and warnings in these logs. Group related errors and explain the likely cause of each group."
            ;;
        summary)
            prompt="Provide a brief summary of what happened on this server during this time period, based on these logs."
            ;;
        *)
            prompt="Analyze these Linux system logs. Identify errors, warnings, and unusual patterns. Provide actionable recommendations."
            ;;
    esac

    echo "$logs" | ollama run llama3.1:8b "$prompt

$(cat)"
}

# Quick shortcuts
alias logai-security='logai security "24 hours ago"'
alias logai-errors='logai errors "1 hour ago"'
alias logai-ssh='logai security "24 hours ago" sshd'
alias logai-nginx='logai errors "6 hours ago" nginx'
Usage:
# General analysis, last hour
logai

# Security analysis, last 24 hours
logai security "24 hours ago"

# Errors from a specific service
logai errors "2 hours ago" docker

# Quick shortcuts
logai-security
logai-ssh
logai-nginx
Real-World Example: Diagnosing a Service Crash Loop
Here is a practical example of how LLM log analysis found a problem that simple monitoring missed. A web application was restarting every few hours with no clear error in its own logs. Traditional monitoring showed the restarts but not the cause.
# Pull all related logs around the restart times
journalctl --since "12 hours ago" --no-pager | \
    grep -B5 -A5 "webapp" | tail -300 | \
    ollama run llama3.1:8b "These logs are from a server where a web application named 'webapp' keeps restarting every few hours. Analyze the surrounding context of each restart to determine the root cause. Look for OOM events, dependency failures, disk issues, or anything that might trigger the restart:

$(cat)"
In this case, the LLM identified that the OOM killer was terminating the process 2-3 minutes after a cron job started a batch data import. The memory spike from the import pushed the server past its memory limit. The cron job and the OOM event appeared in different log sources (cron.log and kernel log), and the 2-3 minute delay between cause and effect made the correlation invisible to simple pattern matching. The LLM connected the dots by recognizing the temporal pattern across the combined log output.
Automated Daily Log Summaries
Set up a daily cron job that emails you a summary of the previous day's log activity:
#!/bin/bash
# /usr/local/bin/daily-log-summary.sh

YESTERDAY=$(date -d 'yesterday' '+%Y-%m-%d')
OUTPUT="/tmp/log-summary-${YESTERDAY}.txt"

echo "=== Daily Log Summary for ${YESTERDAY} ===" > "$OUTPUT"
echo "" >> "$OUTPUT"

# System overview
echo "--- System Overview ---" >> "$OUTPUT"
journalctl --since "${YESTERDAY}" --until "today" --priority=0..4 --no-pager | \
    tail -200 | \
    ollama run llama3.1:8b "Summarize the errors and warnings from this Linux server's logs for the day. Highlight anything that needs immediate attention:" >> "$OUTPUT" 2>&1

echo "" >> "$OUTPUT"

# Security summary
echo "--- Security Summary ---" >> "$OUTPUT"
journalctl --since "${YESTERDAY}" --until "today" -u sshd --no-pager | \
    tail -200 | \
    ollama run llama3.1:8b "Summarize SSH activity for this day. Count successful and failed logins. Flag any suspicious activity:" >> "$OUTPUT" 2>&1

# Send via mail
mail -s "Log Summary: ${YESTERDAY}" admin@example.com < "$OUTPUT"
rm "$OUTPUT"
# Add to crontab
echo "0 7 * * * /usr/local/bin/daily-log-summary.sh" | sudo tee -a /var/spool/cron/crontabs/rootLimitations and When NOT to Use AI for Logs
Honesty about limitations is important because overreliance on LLM analysis will eventually cause you to miss something. Here are the situations where traditional tools are definitively better:
- Counting and statistics — If you need "how many 503 errors in the last hour," use
grep -corawk. An LLM might miscount, and you would never know unless you verified. - Real-time alerting — LLM inference takes seconds to minutes. For real-time monitoring, use Prometheus, Alertmanager, or traditional pattern-matching tools. AI analysis is for post-hoc investigation, not real-time response.
- Exact string matching — If you know exactly what error you are looking for,
grep "ERROR_CODE_123"is instant, deterministic, and free. No reason to involve an LLM. - Very large log volumes — An LLM cannot meaningfully analyze 100,000 log lines. Pre-filter with grep, awk, or journalctl priority/unit filters to get the relevant subset under 300 lines before sending to the model.
- Compliance and legal requirements — LLM output is non-deterministic. The same logs analyzed twice may produce slightly different conclusions. For audit trails or compliance reporting, use deterministic tooling.
- Structured log data — If your logs are already in JSON format with structured fields, tools like jq, Elasticsearch, or Loki are far better at querying specific fields than an LLM.
The best approach combines both: use traditional tools for monitoring, alerting, and exact queries, and use LLM analysis for investigation, pattern discovery, and incident postmortems where you need to understand "what happened" rather than "did X happen."
Privacy and Security Considerations
Running Ollama locally means your log data never leaves your server. This is the primary advantage over cloud AI APIs for log analysis. However, keep these points in mind:
- Make sure Ollama is bound to localhost (127.0.0.1) so log data sent to it is not exposed on the network.
- If multiple users share the Ollama server, be aware that the Ollama process can see all prompts. In a shared environment, each user sees their own analysis results, but the Ollama server logs may contain sensitive log excerpts.
- Ollama does not store conversation history or training data from your prompts. Model weights are read-only. Your log data is processed in memory and discarded after the response is generated.
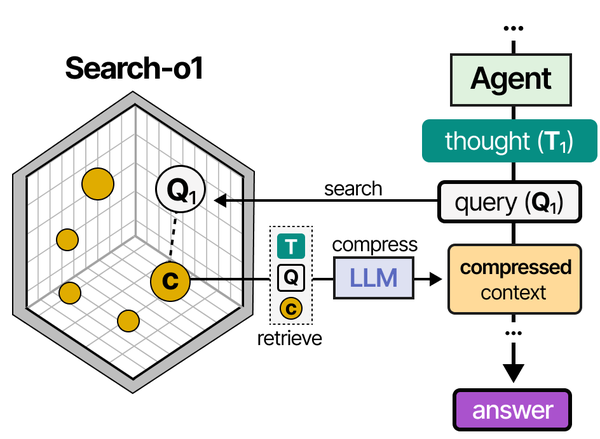
Using Ollama for syslog analysis mirrors the Retrieval-Augmented Generation (RAG) pattern detailed in An Illustrated Guide to AI Agents by Grootendorst and Alammar. The book's RAG pipeline visualization shows how documents are retrieved and fed to an LLM for augmented generation — precisely the approach used when feeding structured log data to a local model for intelligent analysis.
Related Articles
- AI-Powered Monitoring and Alerting on Linux with Open Source Tools
- Ollama Python API: Build Linux Administration Tools with Local LLMs
- n8n and Ollama: Build Self-Hosted AI Automation Workflows on Linux
- AI-Assisted Ansible Troubleshooting with Local LLMs on Linux
Further Reading
- An Illustrated Guide to AI Agents by Maarten Grootendorst and Jay Alammar — Visual guide to agent memory, tools, and reasoning.
- LLMs in Production by Christopher Brousseau and Matthew Sharp — Practical deployment of language models from training to production.
- Agentic AI in Enterprise by Sumit Ranjan, Divya Chembachere, and Lanwin Lobo — Enterprise architecture patterns for agentic AI systems.
Frequently Asked Questions
Which Ollama model is best for log analysis?
Llama 3.1 8B offers the best balance of speed and quality for most log analysis tasks. It handles pattern recognition, error grouping, and security event classification well. For complex incidents involving multiple services and subtle correlations, the 70B model produces noticeably better analysis. Avoid very small models (3B and below) — they frequently hallucinate log entries that do not exist or misclassify error severity.
Can this approach replace a SIEM system?
No. A SIEM (like Splunk, Elastic SIEM, or Wazuh) provides real-time ingestion, indexing, alerting, dashboards, and compliance reporting across your entire infrastructure. LLM log analysis is a complementary investigation tool that you use during incidents or for ad-hoc analysis of specific log excerpts. Think of it as a smart colleague who can read logs with you, not as a replacement for your monitoring stack.
How do I handle logs larger than the model's context window?
Pre-filter aggressively. Use journalctl's priority filter (--priority=0..4) to get only errors and warnings. Use grep -v to exclude known-noisy lines. Use time ranges to narrow the window. If you still have too many lines, split the logs into chunks and analyze each chunk separately, then ask the model to synthesize the individual analyses into a final summary.
Does the LLM ever hallucinate log entries or fabricate analysis?
Yes, and this is the biggest risk. LLMs can confidently report patterns that do not exist, invent IP addresses that never appeared in the logs, or misattribute errors to the wrong service. Always cross-reference the LLM's analysis with the actual logs. Use the LLM to generate hypotheses ("check if X is happening"), then verify those hypotheses with traditional tools (grep, journalctl queries). Never act on LLM analysis alone for critical security decisions.
Can I use this with centralized logging systems like Elasticsearch or Loki?
Yes. Instead of piping journalctl output, query your logging system's API and pipe the results to Ollama. For Elasticsearch, use curl to query the API and format the results. For Loki, use logcli to fetch log entries. The analysis pipeline is the same — the only difference is the log source. This is particularly useful for analyzing logs from multiple servers at once, which is something journalctl on a single host cannot do.