Choosing the right model for a local deployment is not a matter of reading leaderboards — it is a matter of measuring what actually works on your specific hardware, with your specific workloads. A model that scores well on academic benchmarks might be painfully slow on your GPU, or fast but useless for the kind of tasks you need. The only reliable answer comes from running your own benchmarks on your own machine with your own prompts.
This guide covers the full benchmarking workflow on Linux: measuring inference speed (tokens per second), memory consumption (VRAM and system RAM), time-to-first-token latency, response quality evaluation, and building a repeatable comparison framework that lets you test new models as they are released. We use Ollama, llama.cpp, and custom scripts — all free, all running locally.
What to Benchmark and Why
LLM benchmarks fall into two categories: speed metrics and quality metrics. Both matter, and optimizing for only one leads to poor decisions. For the foundational setup, see our complete Ollama installation guide. For GPU driver setup, see our NVIDIA driver and CUDA installation guide.
Speed Metrics
- Tokens per second (tok/s): How fast the model generates output. This is the headline number everyone quotes. Higher is better, and anything above 20 tok/s feels interactive for chat applications.
- Time to first token (TTFT): How long from sending the prompt until the first output token arrives. This includes prompt evaluation time and is heavily affected by prompt length. Under 2 seconds feels responsive; over 5 seconds feels sluggish.
- Prompt evaluation speed: How fast the model processes input tokens. Important for RAG and document processing where prompts are large (thousands of tokens). Measured in tokens per second on the input side.
- Peak VRAM usage: The maximum GPU memory consumed during inference. Determines whether a model fits on your GPU and how much headroom remains for concurrent requests.
Quality Metrics
- Task accuracy: Does the model produce correct outputs for your specific use case? An 8B model might handle code generation well but struggle with complex reasoning.
- Instruction following: Does the model respect output format requirements (JSON, markdown, specific structure)?
- Consistency: Given the same prompt multiple times, does the model produce similar-quality outputs?
Benchmarking with Ollama
Ollama provides built-in timing information that gives you immediate speed metrics without any additional tools.
Basic Speed Test
Enable verbose output to see timing details:
# Single prompt benchmark
ollama run llama3.1:8b --verbose "Write a 500-word essay about Linux kernel development"
At the end of the response, Ollama prints evaluation metrics:
total duration:       8.234s
load duration:        45.12ms
prompt eval count:    18 token(s)
prompt eval duration: 234ms
prompt eval rate:     76.92 tokens/s
eval count:           487 token(s)
eval duration:        7.955s
eval rate:            61.22 tokens/s
The eval rate is your generation speed. The prompt eval rate is your input processing speed. The load duration tells you whether the model was already in memory (fast) or needed to be loaded from disk (slow).
API-Based Benchmarking Script
For systematic testing across multiple models and prompts, use the Ollama API:
#!/bin/bash
# benchmark_models.sh - Compare multiple models with the same prompts

MODELS=("llama3.1:8b" "mistral:7b" "gemma2:9b" "qwen2.5:7b" "phi3:14b")

PROMPTS=(
    "Explain how Linux cgroups work in 200 words"
    "Write a bash script that monitors disk usage and sends alerts"
    "What are the differences between ext4, XFS, and Btrfs?"
    "Generate a systemd service unit for a Python web application"
)

OUTPUT_FILE="benchmark_results_$(date +%Y%m%d_%H%M%S).csv"
echo "model,prompt_num,prompt_eval_rate,eval_rate,eval_count,total_duration_ms" > "$OUTPUT_FILE"

for model in "${MODELS[@]}"; do
    echo "=== Benchmarking: $model ==="

    # Pre-load the model to avoid cold start in measurements
    curl -s http://localhost:11434/api/generate -d "{\"model\":\"$model\",\"prompt\":\"warmup\",\"stream\":false}" > /dev/null

    prompt_num=0
    for prompt in "${PROMPTS[@]}"; do
        prompt_num=$((prompt_num + 1))
        echo "  Prompt $prompt_num..."

        response=$(curl -s http://localhost:11434/api/generate -d "{
            \"model\": \"$model\",
            \"prompt\": \"$prompt\",
            \"stream\": false,
            \"options\": {\"temperature\": 0.1, \"num_predict\": 500}
        }")

        prompt_eval_rate=$(echo "$response" | jq -r ".prompt_eval_duration" | awk "{printf \"%.1f\", $prompt_num / (\$1 / 1000000000)}")
        eval_count=$(echo "$response" | jq -r ".eval_count")
        eval_duration=$(echo "$response" | jq -r ".eval_duration")
        total_duration=$(echo "$response" | jq -r ".total_duration")

        eval_rate=$(echo "$eval_count $eval_duration" | awk "{printf \"%.1f\", \$1 / (\$2 / 1000000000)}")
        total_ms=$(echo "$total_duration" | awk "{printf \"%.0f\", \$1 / 1000000}")

        echo "$model,$prompt_num,$prompt_eval_rate,$eval_rate,$eval_count,$total_ms" >> "$OUTPUT_FILE"
    done
done

echo "Results saved to $OUTPUT_FILE"
chmod +x benchmark_models.sh
./benchmark_models.shBenchmarking with llama-bench
For lower-level benchmarking that bypasses Ollama's overhead, use llama-bench from the llama.cpp project directly. This gives you raw inference performance numbers:
# Install llama.cpp
git clone https://github.com/ggerganov/llama.cpp.git
cd llama.cpp
cmake -B build -DGGML_CUDA=ON
cmake --build build --config Release -j $(nproc)

# Run the built-in benchmark
./build/bin/llama-bench \
    -m /path/to/model.gguf \
    -p 512 \
    -n 128 \
    -ngl 99 \
    -t $(nproc)
Parameters explained:
-p 512: Prompt length (512 tokens) — tests prompt processing speed-n 128: Generate 128 tokens — tests generation speed-ngl 99: Offload all layers to GPU-t $(nproc): Use all CPU threads (for any layers not on GPU)
llama-bench outputs a clean table with prompt processing and generation speeds, making it easy to compare quantization levels:
# Compare quantization levels of the same model
for quant in Q4_K_M Q5_K_M Q6_K Q8_0; do
    echo "--- $quant ---"
    ./build/bin/llama-bench -m "models/llama3.1-8b-$quant.gguf" -p 512 -n 128 -ngl 99
done
VRAM Profiling
Knowing how much VRAM a model consumes is critical for deployment planning. Use nvidia-smi to measure peak usage during inference:
#!/bin/bash
# vram_monitor.sh - Track peak VRAM usage during a benchmark

MODEL="$1"
PEAK_VRAM=0

# Start monitoring in background
while true; do
    current=$(nvidia-smi --query-gpu=memory.used --format=csv,noheader,nounits | head -1)
    if [ "$current" -gt "$PEAK_VRAM" ]; then
        PEAK_VRAM=$current
    fi
    sleep 0.1
done &
MONITOR_PID=$!

# Run the benchmark
curl -s http://localhost:11434/api/generate -d "{
    \"model\": \"$MODEL\",
    \"prompt\": \"Write a detailed technical article about Linux memory management including virtual memory, page tables, swap, and OOM killer behavior. Cover each topic thoroughly.\",
    \"stream\": false,
    \"options\": {\"num_predict\": 2000}
}" > /dev/null

# Stop monitoring
kill $MONITOR_PID 2>/dev/null

echo "Model: $MODEL"
echo "Peak VRAM: ${PEAK_VRAM} MiB"
chmod +x vram_monitor.sh
./vram_monitor.sh llama3.1:8b
./vram_monitor.sh mistral:7bQuality Evaluation Framework
Speed means nothing if the model produces garbage. Build a quality evaluation set with known-good answers and score each model against it:
#!/usr/bin/env python3
# quality_eval.py - Score model output quality

import json
import subprocess

test_cases = [
    {
        "prompt": "What Linux command shows disk space usage for all mounted filesystems? Reply with just the command.",
        "expected_contains": ["df"],
        "category": "factual"
    },
    {
        "prompt": "Write a cron expression that runs a job every Monday at 3 AM. Reply with just the expression.",
        "expected_contains": ["0", "3", "*", "*", "1"],
        "category": "technical"
    },
    {
        "prompt": "Output valid JSON with keys name, age, city for a person named Alice who is 30 and lives in Dublin.",
        "expected_contains": ["Alice", "30", "Dublin"],
        "category": "format"
    },
]

def test_model(model_name):
    scores = {"total": 0, "passed": 0, "failed": 0}

    for i, case in enumerate(test_cases):
        result = subprocess.run(
            ["ollama", "run", model_name, case["prompt"]],
            capture_output=True, text=True, timeout=60
        )
        output = result.stdout.strip().lower()

        passed = all(expected.lower() in output for expected in case["expected_contains"])
        scores["total"] += 1

        if passed:
            scores["passed"] += 1
            print(f"  [{case['category']}] PASS: {case['prompt'][:50]}...")
        else:
            scores["failed"] += 1
            print(f"  [{case['category']}] FAIL: {case['prompt'][:50]}...")
            print(f"    Got: {output[:100]}")

    accuracy = (scores["passed"] / scores["total"]) * 100
    print(f"\n  Score: {scores['passed']}/{scores['total']} ({accuracy:.0f}%)\n")
    return scores

models = ["llama3.1:8b", "mistral:7b", "gemma2:9b"]
for model in models:
    print(f"=== {model} ===")
    test_model(model)
Building a Comparison Dashboard
Combine speed and quality results into a single comparison view. This script outputs a formatted table to the terminal:
#!/bin/bash
# compare_models.sh - Combined speed + quality comparison

printf "%-20s %10s %10s %10s %10s\n" "Model" "tok/s" "TTFT(ms)" "VRAM(MB)" "Quality"
printf "%-20s %10s %10s %10s %10s\n" "--------------------" "----------" "----------" "----------" "----------"

for model in llama3.1:8b mistral:7b gemma2:9b qwen2.5:7b; do
    response=$(curl -s http://localhost:11434/api/generate -d "{
        \"model\": \"$model\",
        \"prompt\": \"Explain the Linux boot process in detail.\",
        \"stream\": false,
        \"options\": {\"num_predict\": 300}
    }")

    eval_count=$(echo "$response" | jq ".eval_count")
    eval_dur=$(echo "$response" | jq ".eval_duration")
    tok_s=$(echo "$eval_count $eval_dur" | awk "{printf \"%.1f\", \$1 / (\$2 / 1e9)}")

    prompt_dur=$(echo "$response" | jq ".prompt_eval_duration")
    ttft=$(echo "$prompt_dur" | awk "{printf \"%.0f\", \$1 / 1e6}")

    vram=$(nvidia-smi --query-gpu=memory.used --format=csv,noheader,nounits | head -1)

    printf "%-20s %10s %10s %10s %10s\n" "$model" "$tok_s" "$ttft" "$vram" "—"
done
Automated Benchmark Scheduling
For tracking performance over time (useful when updating Ollama versions or testing new models), schedule benchmarks with a systemd timer:
sudo tee /etc/systemd/system/llm-benchmark.service > /dev/null << EOF
[Unit]
Description=Weekly LLM Benchmark
After=ollama.service

[Service]
Type=oneshot
User=benchmarker
ExecStart=/opt/benchmarks/benchmark_models.sh
StandardOutput=append:/var/log/llm-benchmarks.log
EOF

sudo tee /etc/systemd/system/llm-benchmark.timer > /dev/null << EOF
[Unit]
Description=Run LLM benchmarks weekly

[Timer]
OnCalendar=Sun 03:00
Persistent=true

[Install]
WantedBy=timers.target
EOF

sudo systemctl enable --now llm-benchmark.timer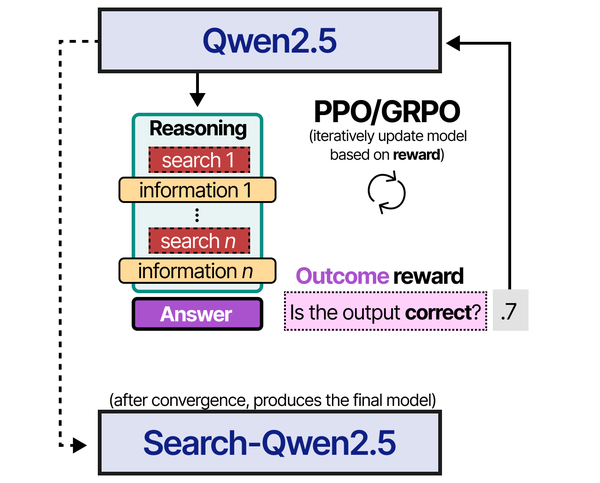
Benchmarking LLMs on Linux requires understanding not just the metrics, but the training approaches behind different models. An Illustrated Guide to AI Agents by Grootendorst and Alammar provides valuable context on reinforcement learning techniques like PPO and GRPO that directly influence model performance — knowledge that helps interpret benchmark results more meaningfully.
Related Articles
- Best Ollama Models for Linux Servers: 2026 Benchmarks and Recommendations
- GGUF Model Format Explained: Quantization Guide for Ollama Users
- Best GPU for Running LLMs Locally on Linux: 2026 Buyer's Guide
- Power Consumption: Running LLMs 24/7 on Linux — Real Electricity Costs
Further Reading
- An Illustrated Guide to AI Agents by Maarten Grootendorst and Jay Alammar — Visual guide to agent memory, tools, and reasoning.
- LLMs in Production by Christopher Brousseau and Matthew Sharp — Practical deployment of language models from training to production.
- Agentic AI in Enterprise by Sumit Ranjan, Divya Chembachere, and Lanwin Lobo — Enterprise architecture patterns for agentic AI systems.
Frequently Asked Questions
Why do my benchmark numbers differ from what I see online?
Online benchmarks are run on specific hardware (often high-end A100 or RTX 4090 GPUs) with specific software versions, batch sizes, and prompt lengths. Your results will differ based on your GPU model, driver version, Ollama version, quantization format, prompt length, and even system background load. This is exactly why running your own benchmarks matters — published numbers are useful for relative comparisons between models but not for predicting absolute performance on your hardware.
Should I benchmark with GPU offloading or CPU-only?
Benchmark both if you plan to run without a GPU on some machines. GPU offloading typically gives 5-20x faster generation than CPU-only for the same model. However, some models are small enough that CPU performance is acceptable (3B models can run at 15-25 tok/s on modern CPUs). Always benchmark with the exact configuration you will deploy in production.
How do I account for concurrent users when benchmarking?
Single-request benchmarks do not reflect multi-user performance. Ollama processes requests sequentially by default (one at a time), so the second user waits while the first request completes. Set OLLAMA_NUM_PARALLEL=4 to allow concurrent request processing, then run multiple benchmark scripts simultaneously to measure throughput degradation. Expect per-user speed to decrease roughly linearly with the number of concurrent requests until VRAM or compute becomes the bottleneck.