Running Ollama on a single server works until it does not. The moment you have more than a handful of users, need high availability, or want to scale inference across multiple GPUs, Kubernetes becomes the obvious platform. But deploying GPU workloads on Kubernetes is not the same as deploying a typical web application. GPU scheduling, device plugins, model persistence, and memory management all introduce complexity that does not exist in CPU-only deployments. This guide covers a production-grade Ollama deployment on Kubernetes, from initial cluster setup through monitoring and scaling.
Brousseau and Sharp address the specific challenges of LLM serving on Kubernetes in LLMs in Production. LLM pods have unique characteristics that complicate scheduling: they require GPUs with specific VRAM minimums, they have long startup times (loading model weights into GPU memory takes 10-60 seconds), and they benefit from persistent scheduling (keeping a model loaded on the same GPU across requests). They recommend using Kubernetes node affinity rules to pin LLM pods to GPU nodes, readiness probes that wait until the model is loaded, and horizontal pod autoscaling based on request queue depth rather than CPU utilization.
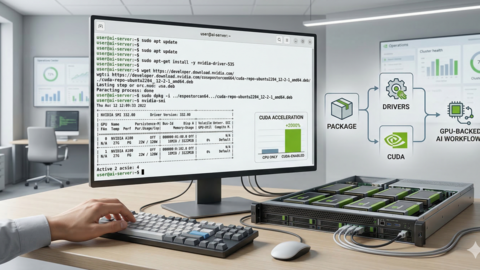
Deploying Ollama on Kubernetes transforms a single-server LLM setup into a scalable inference platform. Ranjan et al. describe in Agentic AI in Enterprise that Kubernetes with the NVIDIA GPU Operator has become the de facto standard for enterprise AI infrastructure. The GPU Operator automates driver installation, device plugin registration, and monitoring across all GPU nodes, eliminating the manual setup that makes bare-metal GPU management painful. Combined with the NVIDIA Device Plugin for Kubernetes, it enables GPU resource requests in pod specs just like CPU and memory requests.
I have run this setup across clusters ranging from a single-node k3s instance with one GPU to a multi-node cluster with mixed NVIDIA hardware. The patterns here work at both scales. The main difference between a hobby deployment and a production one is not the Ollama configuration itself — it is the infrastructure around it: persistent storage that survives pod restarts, health checks that catch OOM kills, and monitoring that tells you when the GPU is actually the bottleneck versus when it is something else entirely.
Prerequisites
Before deploying Ollama, your Kubernetes cluster needs GPU support. This is the part most guides gloss over, but it is where most deployments fail. You need three things in place:
- NVIDIA GPU drivers installed on every GPU node (version 525+ recommended)
- NVIDIA Container Toolkit (formerly nvidia-docker2) installed on every GPU node
- The NVIDIA device plugin DaemonSet running in the cluster
Verify your nodes have GPU support:
# Check if NVIDIA drivers are loaded on a node
kubectl debug node/gpu-node-1 -it --image=ubuntu -- nvidia-smi

# If you have SSH access to the node directly:
nvidia-smi
# Should show your GPU(s) with driver version
Installing the NVIDIA Device Plugin
The device plugin is a DaemonSet that exposes GPUs as schedulable resources in Kubernetes. Without it, the scheduler has no idea that GPUs exist on your nodes.
# Install via Helm (recommended)
helm repo add nvdp https://nvidia.github.io/k8s-device-plugin
helm repo update

helm install nvidia-device-plugin nvdp/nvidia-device-plugin \
    --namespace nvidia-device-plugin \
    --create-namespace \
    --set gfd.enabled=true
The gfd.enabled=true flag enables GPU Feature Discovery, which labels nodes with detailed GPU information (model, memory, compute capability). This is essential for scheduling decisions when you have mixed GPU hardware.
Verify GPUs are visible to the scheduler:
kubectl get nodes -o json | jq '.items[] | {name: .metadata.name, gpus: .status.capacity["nvidia.com/gpu"]}'

# Expected output:
# { "name": "gpu-node-1", "gpus": "2" }
# { "name": "gpu-node-2", "gpus": "1" }
If the GPU count shows null, the device plugin is not running correctly. Check its logs:
kubectl logs -n nvidia-device-plugin -l app.kubernetes.io/name=nvidia-device-pluginDeploying Ollama with Helm
The community-maintained Helm chart from otwld provides a solid starting point. It handles the Deployment, Service, PVC, and optional Ingress.
helm repo add ollama-helm https://otwld.github.io/ollama-helm/
helm repo update

# Install with GPU support and persistent storage
helm install ollama ollama-helm/ollama \
    --namespace ollama \
    --create-namespace \
    --set ollama.gpu.enabled=true \
    --set ollama.gpu.type=nvidia \
    --set ollama.gpu.number=1 \
    --set persistentVolume.enabled=true \
    --set persistentVolume.size=100Gi
This creates a Deployment with one replica requesting one NVIDIA GPU, backed by a 100Gi PersistentVolumeClaim for model storage. The chart defaults are sensible for a starter deployment, but production requires more tuning.
Custom values.yaml for Production
Create a values file that configures everything properly:
# ollama-values.yaml
replicaCount: 1

ollama:
  gpu:
    enabled: true
    type: nvidia
    number: 1
  models:
    - llama3.1:8b
    - nomic-embed-text

image:
  repository: ollama/ollama
  tag: latest
  pullPolicy: IfNotPresent

resources:
  requests:
    cpu: "2"
    memory: "16Gi"
    nvidia.com/gpu: "1"
  limits:
    cpu: "8"
    memory: "32Gi"
    nvidia.com/gpu: "1"

persistentVolume:
  enabled: true
  size: 200Gi
  storageClass: "local-path"  # Adjust to your storage class
  accessModes:
    - ReadWriteOnce

service:
  type: ClusterIP
  port: 11434

ingress:
  enabled: true
  className: nginx
  annotations:
    cert-manager.io/cluster-issuer: letsencrypt-prod
    nginx.ingress.kubernetes.io/proxy-body-size: "100m"
    nginx.ingress.kubernetes.io/proxy-read-timeout: "600"
    nginx.ingress.kubernetes.io/proxy-send-timeout: "600"
    nginx.ingress.kubernetes.io/proxy-buffering: "off"
  hosts:
    - host: ollama.example.com
      paths:
        - path: /
          pathType: Prefix
  tls:
    - secretName: ollama-tls
      hosts:
        - ollama.example.com

livenessProbe:
  enabled: true
  path: /
  initialDelaySeconds: 60
  periodSeconds: 15
  timeoutSeconds: 5
  failureThreshold: 6

readinessProbe:
  enabled: true
  path: /
  initialDelaySeconds: 30
  periodSeconds: 5
  timeoutSeconds: 3
  failureThreshold: 3

tolerations:
  - key: nvidia.com/gpu
    operator: Exists
    effect: NoSchedule

nodeSelector:
  nvidia.com/gpu.present: "true"

affinity:
  nodeAffinity:
    requiredDuringSchedulingIgnoredDuringExecution:
      nodeSelectorTerms:
        - matchExpressions:
            - key: nvidia.com/gpu.product
              operator: In
              values:
                - NVIDIA-GeForce-RTX-4090
                - NVIDIA-A100-SXM4-80GB
Install with the custom values:
helm install ollama ollama-helm/ollama \
    --namespace ollama \
    --create-namespace \
    -f ollama-values.yaml
GPU Resource Requests and Limits
GPU scheduling in Kubernetes works differently from CPU and memory. A few things to understand:
- GPUs cannot be shared between pods natively. Requesting
nvidia.com/gpu: 1gives the pod exclusive access to one full GPU. - GPU requests and limits must be equal. You cannot request 0.5 GPUs or set a request of 1 with a limit of 2.
- If a node has 2 GPUs, it can run at most 2 pods that each request 1 GPU.
For Ollama specifically, the GPU memory is the real constraint, not the GPU count. A 7B model needs roughly 4-6 GB of VRAM, a 13B model needs 8-10 GB, and a 70B model needs 40+ GB. If your GPU has 24 GB of VRAM, you can theoretically load multiple smaller models simultaneously.
# Check GPU memory allocation on running pods
kubectl exec -n ollama deployment/ollama -- nvidia-smi

# Watch GPU utilization in real time
kubectl exec -n ollama deployment/ollama -- watch -n 1 nvidia-smi
GPU Time-Slicing for Shared Access
If you want multiple Ollama instances sharing a single GPU (for example, one for chat and one for embeddings), NVIDIA's GPU time-slicing feature lets you do this without MIG-capable hardware:
# Create a ConfigMap for time-slicing
apiVersion: v1
kind: ConfigMap
metadata:
  name: nvidia-device-plugin-config
  namespace: nvidia-device-plugin
data:
  config.yaml: |
    version: v1
    sharing:
      timeSlicing:
        resources:
          - name: nvidia.com/gpu
            replicas: 4
This makes each physical GPU appear as 4 schedulable GPUs. The pods share the GPU via context switching. Performance degrades under contention, but for mixed workloads (one pod doing chat, another doing embeddings), the practical impact is often acceptable.
Persistent Storage for Models
Models are the most expensive resource to download. A single 70B model can be 40+ GB. Without persistent storage, every pod restart triggers a full re-download, which can take 30+ minutes on a fast connection. The PVC in the Helm chart handles this, but there are details worth understanding.
Ollama stores models in /root/.ollama by default. The Helm chart mounts the PVC at this path. For production, consider using a storage class that provides good sequential read performance — models are loaded into GPU memory at startup, and slow storage adds minutes to pod startup time.
# Check PVC status
kubectl get pvc -n ollama

# NAME                STATUS   VOLUME     CAPACITY   ACCESS MODES   STORAGECLASS
# ollama-data-pvc     Bound    pv-xxxxx   200Gi      RWO            local-path

# Check actual disk usage
kubectl exec -n ollama deployment/ollama -- du -sh /root/.ollama/models/
# 47G  /root/.ollama/models/
Model Pre-Loading with Init Containers
The Helm chart's ollama.models list pulls models on startup, but this happens sequentially in the main container, delaying readiness. For faster startup, use an init container that pulls models before the main Ollama process starts:
apiVersion: apps/v1
kind: Deployment
metadata:
  name: ollama
  namespace: ollama
spec:
  replicas: 1
  selector:
    matchLabels:
      app: ollama
  template:
    metadata:
      labels:
        app: ollama
    spec:
      initContainers:
        - name: model-puller
          image: ollama/ollama:latest
          command: ["/bin/sh", "-c"]
          args:
            - |
              ollama serve &
              sleep 5
              ollama pull llama3.1:8b
              ollama pull nomic-embed-text
              kill %1
          volumeMounts:
            - name: ollama-data
              mountPath: /root/.ollama
          resources:
            requests:
              cpu: "1"
              memory: "4Gi"
      containers:
        - name: ollama
          image: ollama/ollama:latest
          ports:
            - containerPort: 11434
          volumeMounts:
            - name: ollama-data
              mountPath: /root/.ollama
          resources:
            requests:
              nvidia.com/gpu: "1"
              cpu: "2"
              memory: "16Gi"
            limits:
              nvidia.com/gpu: "1"
              cpu: "8"
              memory: "32Gi"
      volumes:
        - name: ollama-data
          persistentVolumeClaim:
            claimName: ollama-data-pvc
      tolerations:
        - key: nvidia.com/gpu
          operator: Exists
          effect: NoSchedule
      nodeSelector:
        nvidia.com/gpu.present: "true"
The init container does not need GPU access — it only downloads model files to the PVC. The main container then starts with models already on disk, significantly reducing time-to-ready.
Health Checks and Readiness Probes
Proper health checks are critical for GPU workloads because Ollama can fail in ways that are not obvious from the outside. The process might still be running but unable to allocate GPU memory, or it might be stuck loading a model.
livenessProbe:
  httpGet:
    path: /
    port: 11434
  initialDelaySeconds: 60
  periodSeconds: 15
  timeoutSeconds: 5
  failureThreshold: 6
  # Total tolerance: 60 + (6 * 15) = 150 seconds

readinessProbe:
  httpGet:
    path: /api/tags
    port: 11434
  initialDelaySeconds: 30
  periodSeconds: 5
  timeoutSeconds: 3
  failureThreshold: 3
The liveness probe hits the root endpoint, which returns a simple OK if the HTTP server is running. The readiness probe hits /api/tags, which requires model management to be functional. The distinction matters: a pod can be alive (HTTP server up) but not ready (models still loading).
The generous initialDelaySeconds and failureThreshold values account for model loading time. If you reduce these, Kubernetes will restart the pod before models finish loading, creating a restart loop.
Ingress with TLS
The Helm chart's Ingress configuration works with cert-manager for automatic TLS. If you are not using the Helm chart, here is a standalone Ingress resource:
apiVersion: networking.k8s.io/v1
kind: Ingress
metadata:
  name: ollama-ingress
  namespace: ollama
  annotations:
    cert-manager.io/cluster-issuer: letsencrypt-prod
    nginx.ingress.kubernetes.io/proxy-body-size: "100m"
    nginx.ingress.kubernetes.io/proxy-read-timeout: "600"
    nginx.ingress.kubernetes.io/proxy-send-timeout: "600"
    nginx.ingress.kubernetes.io/proxy-buffering: "off"
    nginx.ingress.kubernetes.io/configuration-snippet: |
      proxy_cache off;
      chunked_transfer_encoding on;
spec:
  ingressClassName: nginx
  tls:
    - hosts:
        - ollama.example.com
      secretName: ollama-tls
  rules:
    - host: ollama.example.com
      http:
        paths:
          - path: /
            pathType: Prefix
            backend:
              service:
                name: ollama
                port:
                  number: 11434
The critical annotations are proxy-buffering: "off" (for streaming) and the extended timeouts. Without the 600-second read timeout, long generation requests will 504 through the ingress controller.
Horizontal Scaling Considerations
Scaling Ollama horizontally (multiple replicas) is not as straightforward as scaling a stateless web service. Each replica needs its own GPU, and model state is not shared between replicas. Here are the approaches that actually work:
Approach 1: Multiple Replicas with Shared Storage
If your storage class supports ReadWriteMany (like NFS or CephFS), multiple replicas can share the same model storage:
replicaCount: 3

persistentVolume:
  accessModes:
    - ReadWriteMany  # Must be supported by storage class
Each replica still needs its own GPU. With 3 replicas and 1 GPU per replica, you need at least 3 GPUs across your cluster. The Kubernetes Service load-balances requests across replicas.
Approach 2: Separate Deployments per Model
For teams that use different models for different tasks, deploy separate Ollama instances per model:
# ollama-chat deployment — large model for interactive use
helm install ollama-chat ollama-helm/ollama \
    --namespace ollama \
    -f chat-values.yaml  # llama3.1:70b, 1 GPU (A100)

# ollama-embed deployment — small model for embeddings
helm install ollama-embed ollama-helm/ollama \
    --namespace ollama \
    -f embed-values.yaml  # nomic-embed-text, 1 GPU (RTX 4090)
This gives you independent scaling and resource allocation per workload type. The embedding service can use cheaper GPUs since embedding models are small, while the chat service gets the big GPU.
Approach 3: Kubernetes HPA with Custom Metrics
Standard CPU-based HPA does not work for GPU workloads. Instead, use custom metrics from DCGM (Data Center GPU Manager) or Prometheus GPU metrics:
apiVersion: autoscaling/v2
kind: HorizontalPodAutoscaler
metadata:
  name: ollama-hpa
  namespace: ollama
spec:
  scaleTargetRef:
    apiVersion: apps/v1
    kind: Deployment
    name: ollama
  minReplicas: 1
  maxReplicas: 4
  metrics:
    - type: Pods
      pods:
        metric:
          name: DCGM_FI_DEV_GPU_UTIL
        target:
          type: AverageValue
          averageValue: "80"
This scales Ollama pods based on GPU utilization. When average utilization exceeds 80%, the HPA adds a replica (provided GPUs are available in the cluster).
Monitoring with Prometheus
GPU monitoring requires the DCGM Exporter, which exposes NVIDIA GPU metrics in Prometheus format.
# Install DCGM Exporter
helm repo add gpu-helm-charts https://nvidia.github.io/dcgm-exporter/helm-charts
helm repo update

helm install dcgm-exporter gpu-helm-charts/dcgm-exporter \
    --namespace monitoring \
    --create-namespace
Create a ServiceMonitor for Prometheus:
apiVersion: monitoring.coreos.com/v1
kind: ServiceMonitor
metadata:
  name: dcgm-exporter
  namespace: monitoring
spec:
  selector:
    matchLabels:
      app.kubernetes.io/name: dcgm-exporter
  endpoints:
    - port: metrics
      interval: 15s
Key metrics to watch:
# GPU utilization (percentage)
DCGM_FI_DEV_GPU_UTIL

# GPU memory used (bytes)
DCGM_FI_DEV_FB_USED

# GPU memory total (bytes)
DCGM_FI_DEV_FB_FREE + DCGM_FI_DEV_FB_USED

# GPU temperature
DCGM_FI_DEV_GPU_TEMP

# Power usage
DCGM_FI_DEV_POWER_USAGE
Add Ollama-specific monitoring by scraping the Ollama API from a Prometheus probe or a custom exporter. A simple approach is a CronJob that queries Ollama's running models and pushes metrics to Pushgateway:
apiVersion: batch/v1
kind: CronJob
metadata:
  name: ollama-metrics
  namespace: ollama
spec:
  schedule: "*/1 * * * *"
  jobTemplate:
    spec:
      template:
        spec:
          containers:
            - name: metrics
              image: curlimages/curl:latest
              command: ["/bin/sh", "-c"]
              args:
                - |
                  MODELS=$(curl -s http://ollama.ollama:11434/api/tags | grep -c '"name"')
                  RUNNING=$(curl -s http://ollama.ollama:11434/api/ps | grep -c '"name"')
                  cat <<METRICS | curl --data-binary @- http://prometheus-pushgateway.monitoring:9091/metrics/job/ollama
                  ollama_models_available $MODELS
                  ollama_models_loaded $RUNNING
                  METRICS
          restartPolicy: OnFailure
Namespace Organization and RBAC
For production clusters, isolate Ollama in its own namespace with appropriate RBAC:
# Namespace with resource quotas
apiVersion: v1
kind: Namespace
metadata:
  name: ollama
---
apiVersion: v1
kind: ResourceQuota
metadata:
  name: ollama-quota
  namespace: ollama
spec:
  hard:
    requests.nvidia.com/gpu: "4"
    limits.nvidia.com/gpu: "4"
    requests.cpu: "16"
    requests.memory: "128Gi"
    persistentvolumeclaims: "10"
The GPU quota prevents the Ollama namespace from consuming every GPU in the cluster, leaving room for other GPU workloads.
Troubleshooting GPU Scheduling Failures
Pod stuck in Pending state
The most common issue. Check the pod events:
kubectl describe pod -n ollama ollama-xxxxx

# Look for:
# "0/3 nodes are available: 3 Insufficient nvidia.com/gpu"
This means no node has available GPUs. Either all GPUs are allocated to other pods, or the device plugin is not running. Check GPU allocation:
kubectl describe node gpu-node-1 | grep -A5 "Allocated resources"OOMKilled by GPU memory
When a model exceeds available VRAM, Ollama crashes and Kubernetes restarts the pod. The pod events will show OOMKilled. The fix is to either use a smaller model or a GPU with more memory. You can also set OLLAMA_MAX_LOADED_MODELS=1 as an environment variable to prevent multiple models from being loaded simultaneously.
Slow model loading on pod restart
If models take forever to load on restart, the storage is the bottleneck. Network-attached storage (like EBS or Ceph) can be 10-100x slower than local NVMe for sequential reads. Switch to local-path storage class or use a hostPath volume if model loading time is critical.
Frequently Asked Questions
Can I run Ollama on Kubernetes without a GPU?
Yes, but performance is dramatically worse. CPU inference on a 7B model produces roughly 5-10 tokens per second versus 50-100+ tokens per second on a modern GPU. For production workloads with real users, CPU-only deployment is only viable for embedding generation, not interactive chat. Set ollama.gpu.enabled=false in the Helm values and remove the GPU resource requests.
How much storage do I need for models?
A 7B model is roughly 4 GB, a 13B model is 7-8 GB, a 34B model is 19 GB, and a 70B model is 40 GB. If you plan to keep multiple models available, 200 GB is a reasonable starting point. Use kubectl exec to check actual usage periodically and expand the PVC if needed (most CSI drivers support online volume expansion).
Should I use a DaemonSet or Deployment for Ollama?
Use a Deployment. A DaemonSet runs one pod on every node, which wastes resources on nodes without GPUs and gives you no control over replica count. A Deployment with nodeSelector constraints gives you precise control over which nodes run Ollama and how many instances exist.
Can I use spot/preemptible instances for GPU nodes?
You can, and it cuts GPU costs by 60-70%. The trade-off is that your pods may be evicted with minimal warning. Combine spot instances with PersistentVolumeClaims (so models survive eviction) and PodDisruptionBudgets (to prevent all replicas from being evicted simultaneously). Set the ollama.models list in the Helm chart so models are automatically re-pulled after eviction.
How do I upgrade Ollama in Kubernetes without downtime?
Use a rolling update strategy with maxSurge: 1 and maxUnavailable: 0. Kubernetes creates a new pod with the updated image, waits for it to pass readiness checks (which includes model loading), then terminates the old pod. This requires at least one additional GPU to be available during the rollout. If no spare GPU exists, set maxUnavailable: 1 and accept a brief outage during the update.
Related Articles
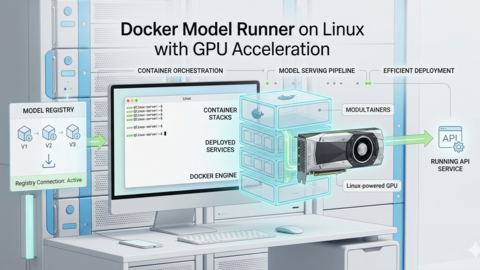
- Ollama Docker Compose: Complete GPU Stack for Linux
- vLLM on Linux: Production Deployment Guide for High-Throughput Inference
- Ollama API Rate Limiting and Load Balancing on Linux
- Self-Hosted AI Stack for Linux Sysadmins: Complete Reference Architecture
Further Reading
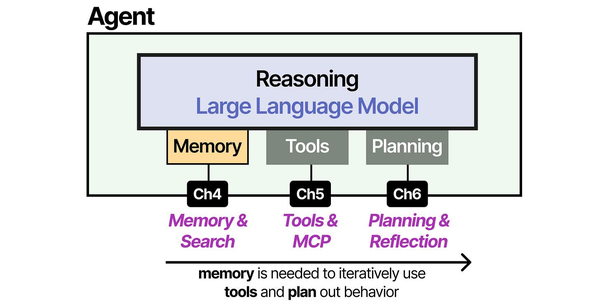
- Grootendorst, M. & Alammar, J. (2025). An Illustrated Guide to AI Agents. O'Reilly Media. Covers agent memory systems, RAG pipelines, tool usage, MCP protocol, and context engineering with clear visual explanations.
- Ranjan, R. et al. (2025). Agentic AI in Enterprise. Apress. Explores enterprise AI architecture, RAG vs fine-tuning trade-offs, vector databases, prompt engineering, GPU acceleration, and Kubernetes orchestration for production AI.
- Brousseau, D. & Sharp, T. (2025). LLMs in Production. Manning Publications. Covers neural network fundamentals, transformer architecture, GPU management, latency optimization, Kubernetes deployment, MLOps pipelines, embeddings, and model quantization.